1
2
3
4
5
6
7
8
9
10
11
12
13
14
15
16
17
18
19
20
21
22
23
24
25
26
27
28
29
30
31
32
33
34
35
36
37
38
39
40
41
42
43
44
45
46
47
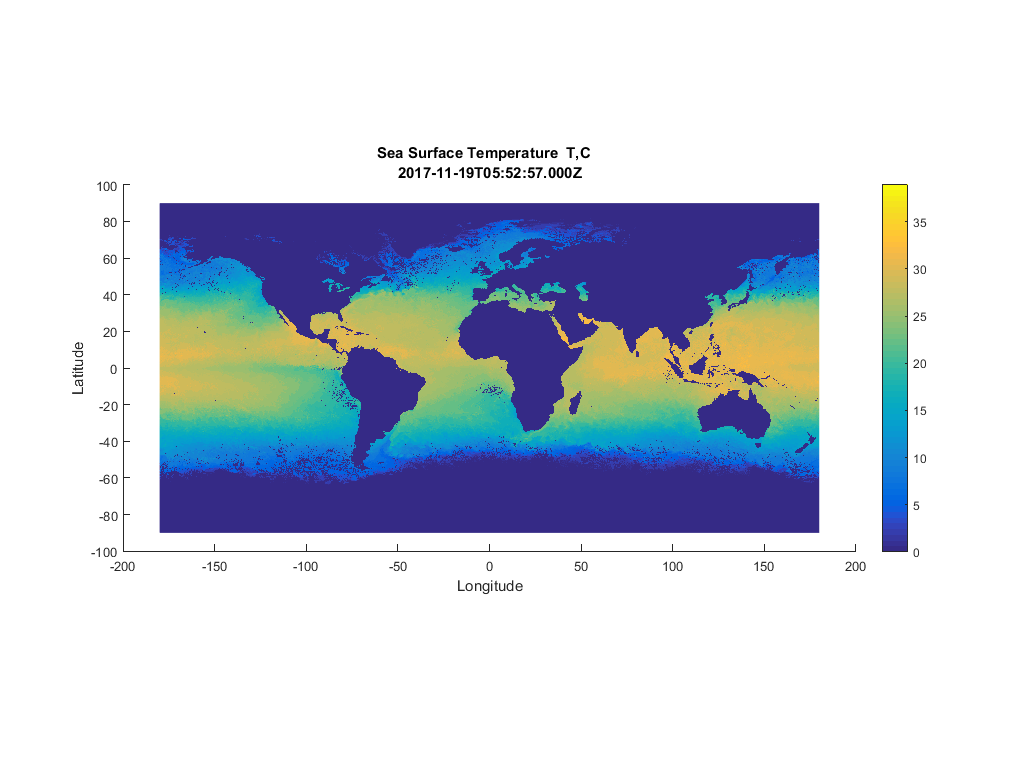
48
49
50
51
52
53
54
55
56
57
58
59
60
61
62
63
64
65
66
67
68
69
70
71
72
73
74
75
76
77
78
79
80
81
82
83
84
85
86
87
88
89
90
91
92
93
94
95
96
97
98
99
100
101
102
103
104
105
106
107
108
109
110
111
112
113
114
115
116
117
118
119
120
121
122
123
124
125
126
127
128
129
130
131
132
133
134
135
136
137
138
139
140
141
142
143
144
145
146
147
148
149
150
151
152
153
154
155
156
157
158
159
160
161
162
163
164
165
166
167
168
169
170
171
172
173 | %% Generate magnetic field parameters using WMM and IGRF models as well to SST data
% Made by Ali Aljumaili (Ali.jum@outlook.com) for data storage tag project
clear all
close all
clc
%% Make 'datadir' folder in Current Folder
datadir = fullfile(pwd, 'datadir');
if ~exist(datadir, 'dir')
mkdir(datadir)
end
datafile = @(filename)fullfile(datadir, filename);
%% set the latitude and longitude limits
latlimits = [63 79];
lonlimits = [0 27];
%% NetCDF (SST DATA)
% https://data.nodc.noaa.gov/cgi-bin/iso?id=gov.noaa.nodc:AVHRR_Pathfinder-NCEI-L3C-v5.3
% ftp://ftp.nodc.noaa.gov/pub/data.nodc/pathfinder/Version5.3/L3C/
% http://coastwatch.pfeg.noaa.gov/erddap/griddap/erdMH1sstdmday.html
% the file example: A20172742017304.L3m_MO_SST_sst_4km.nc
[file,folder] = uigetfile('*.nc', 'Select the NetCDF file');
filename = fullfile(folder,file)
finfo = ncinfo(filename);
%disp(finfo);
AttrNames = {finfo.Attributes.Name};
minMatch = strncmpi(AttrNames,'data_minimun',10);
maxMatch = strncmpi(AttrNames,'data_maximun',10);
dateMatch = strncmpi(AttrNames,'date_created',10);
AttrVal = {finfo.Attributes.Value};
minVal = cell2mat(AttrVal(find(minMatch,1)));
maxVal = cell2mat(AttrVal(find(maxMatch,1)));
dateVal = AttrVal(find(dateMatch,1));
ncid = netcdf.open(filename);
varname_sst = netcdf.inqVar(ncid,0);
varname_lat = netcdf.inqVar(ncid,2);
varname_lon = netcdf.inqVar(ncid,3);
varname_pal = netcdf.inqVar(ncid,4);
varid_sst = netcdf.inqVarID(ncid,varname_sst);
varid_lat = netcdf.inqVarID(ncid,varname_lat);
varid_lon = netcdf.inqVarID(ncid,varname_lon);
varid_pal = netcdf.inqVarID(ncid,varname_pal);
sst = netcdf.getVar(ncid,varid_sst);
sst(sst<=-32767 | sst>=32767)=nan;
sst = double(sst);
sstC = sst*(maxVal-minVal)/(max(sst(:))-min(sst(:)));
lat = netcdf.getVar(ncid,varid_lat);
lon = netcdf.getVar(ncid,varid_lon);
% plot full lat-lon range
figure(1)
[latgrid, longrid] = meshgrid(lat,lon);
geoshow(latgrid,longrid,uint8(sstC),'DisplayType', 'texturemap')
hcb = colorbar('eastoutside');
title(['Sea Surface Temperature T,C ', dateVal])
xlabel('Longitude')
ylabel('Latitude')
% select lat-lon range
rangelat = find(lat>latlimits(1) & lat<latlimits(2));
rangelon = find(lon>lonlimits(1) & lon<lonlimits(2));
sstC_clip = sstC(rangelon,rangelat);
lat_clip = double(lat(rangelat));
lon_clip = double(lon(rangelon));
% plot selected lat-lon range
figure(2)
[latgrid, longrid] = meshgrid(lat_clip,lon_clip);
geoshow(latgrid,longrid,uint8(sstC_clip),'DisplayType', 'texturemap')
hcb = colorbar('eastoutside');
title(['Sea Surface Temperature T,C ', dateVal])
xlabel('Longitude')
ylabel('Latitude')
R = georefcells([lat_clip(end) lat_clip(1)],[lon_clip(1) lon_clip(end)],...
size(sstC_clip'),'ColumnsStartFrom','north');
filename_geotiff = datafile('sst.tif');
geotiffwrite(filename_geotiff,sstC_clip',R)
%% WMM (World Magnetic model)
listlat = lat_clip';
listlon = lon_clip';
%% Magneticfield parameters
%declination, inclination, horizontal component, north component,
%east component, vertical component, and total field
xyz = zeros(length(listlat), length(listlon), 3);
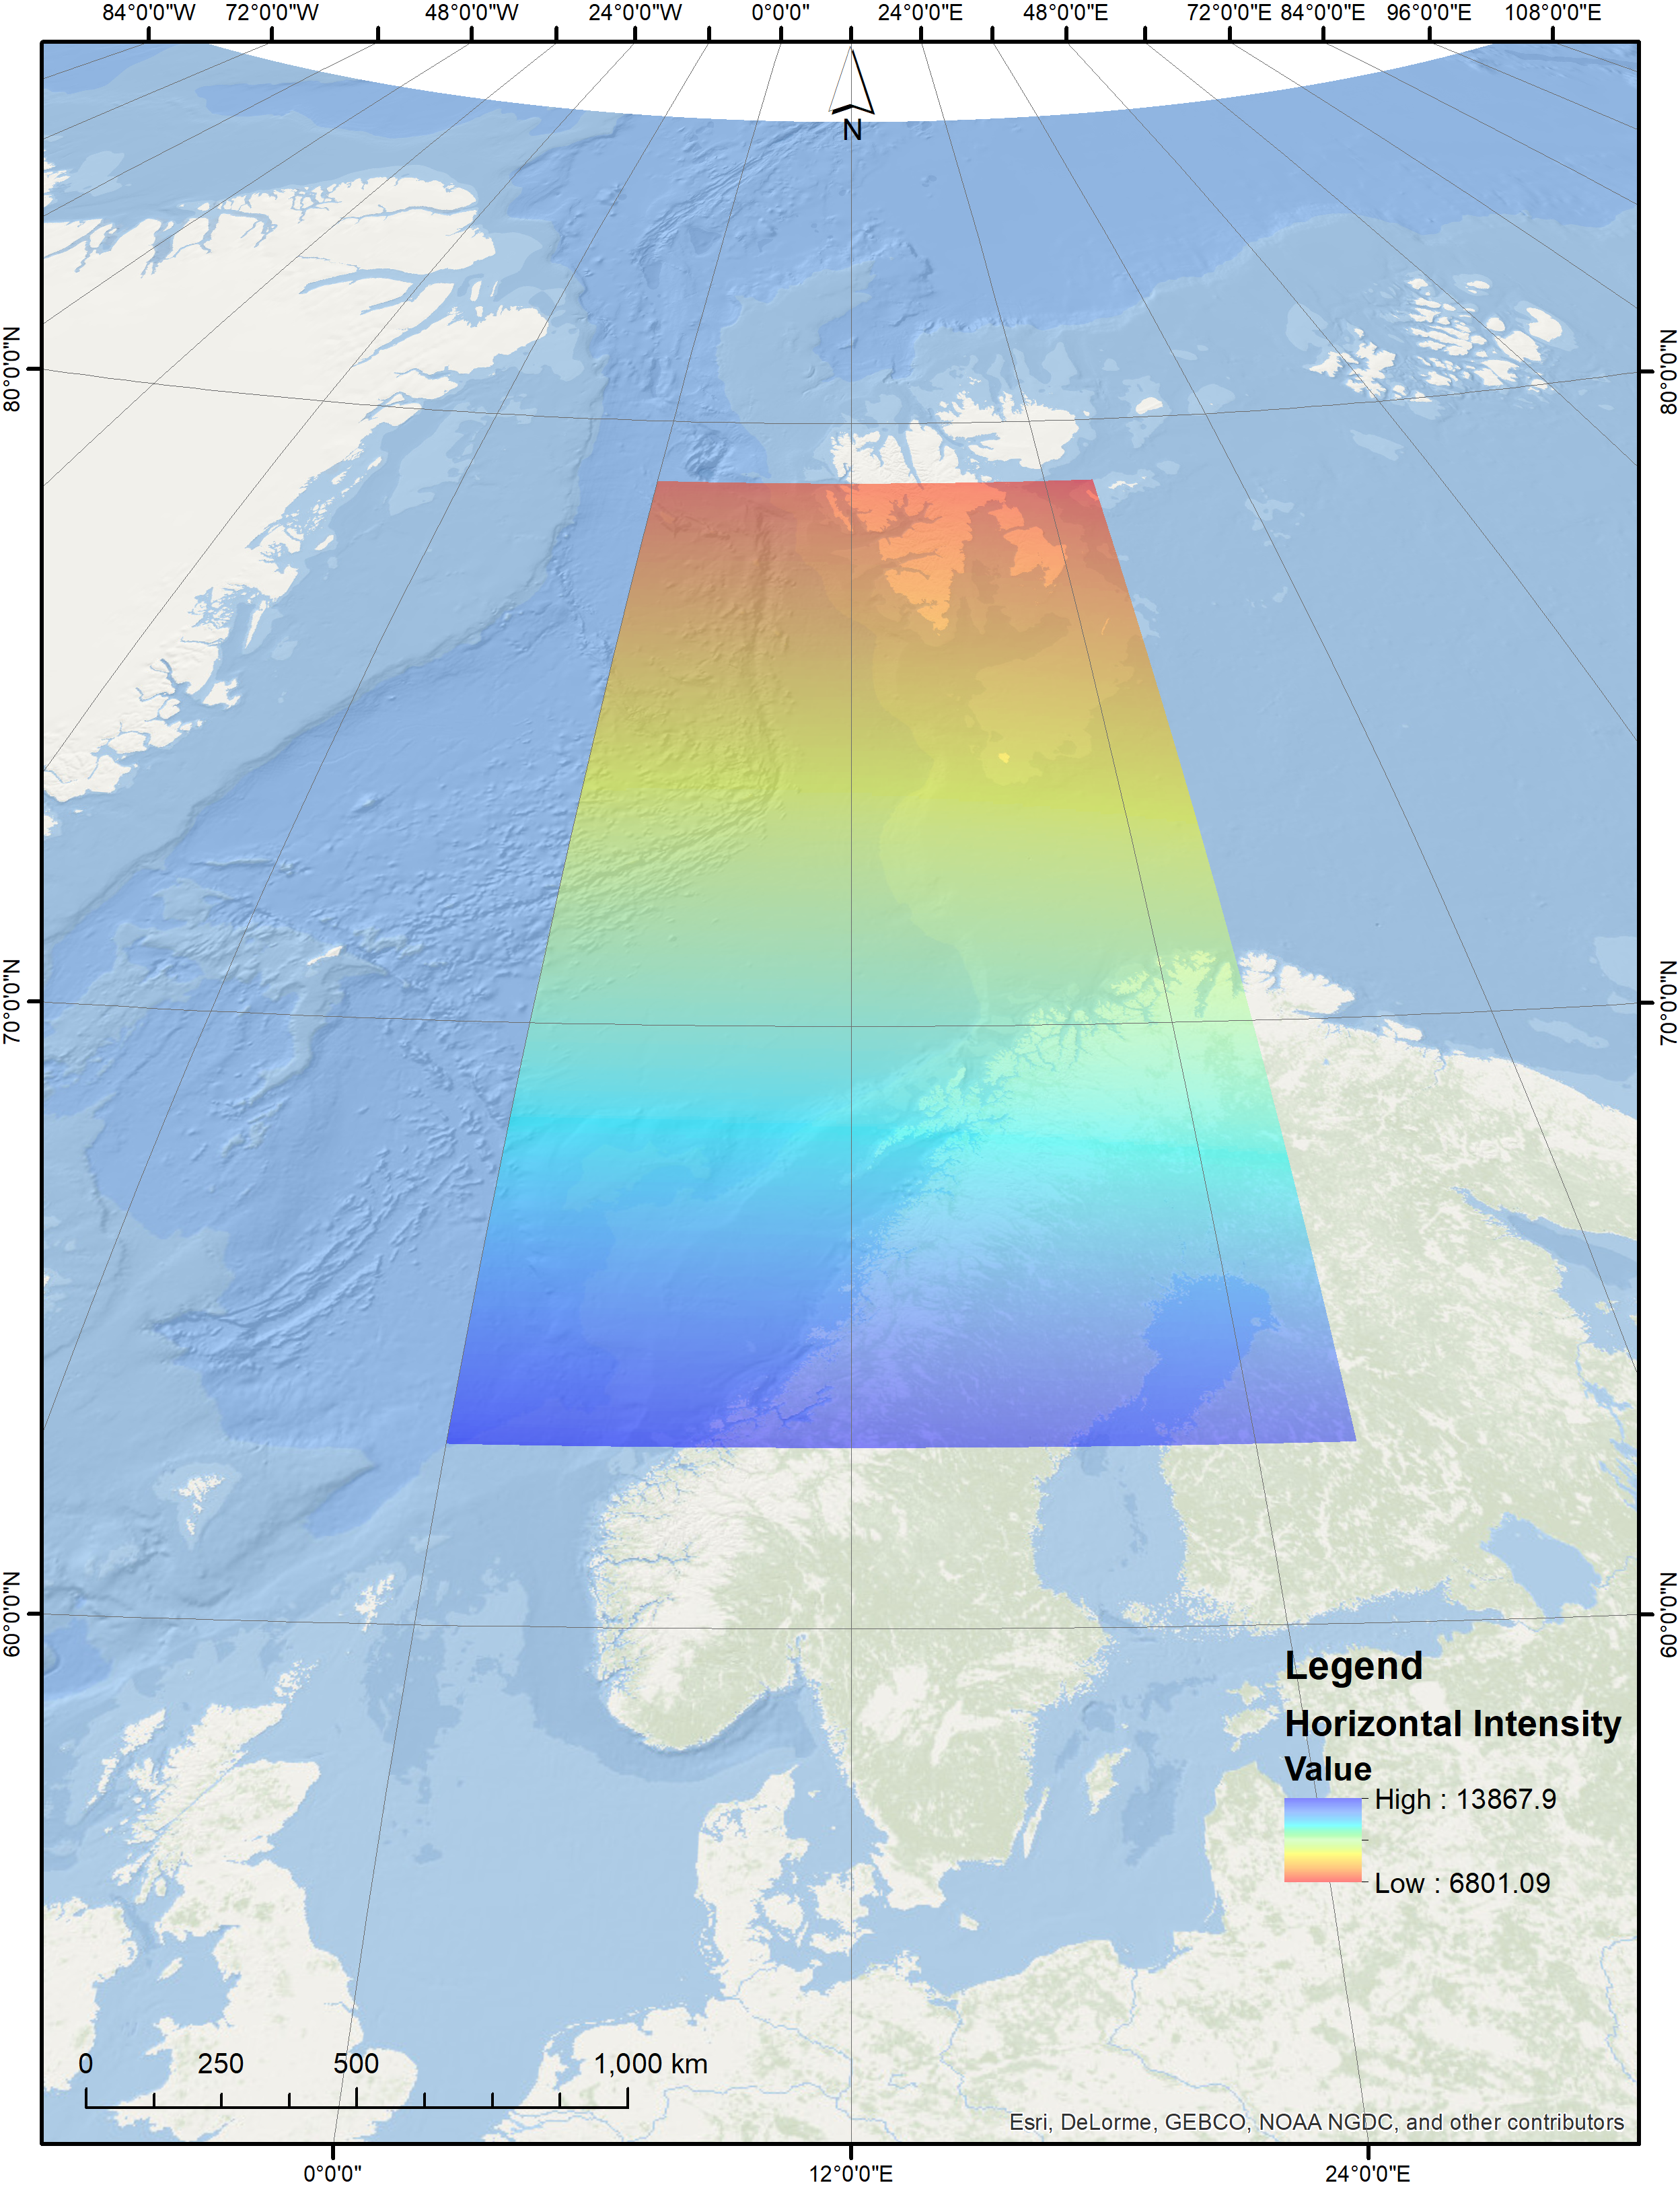
h = zeros(length(listlat), length(listlon));
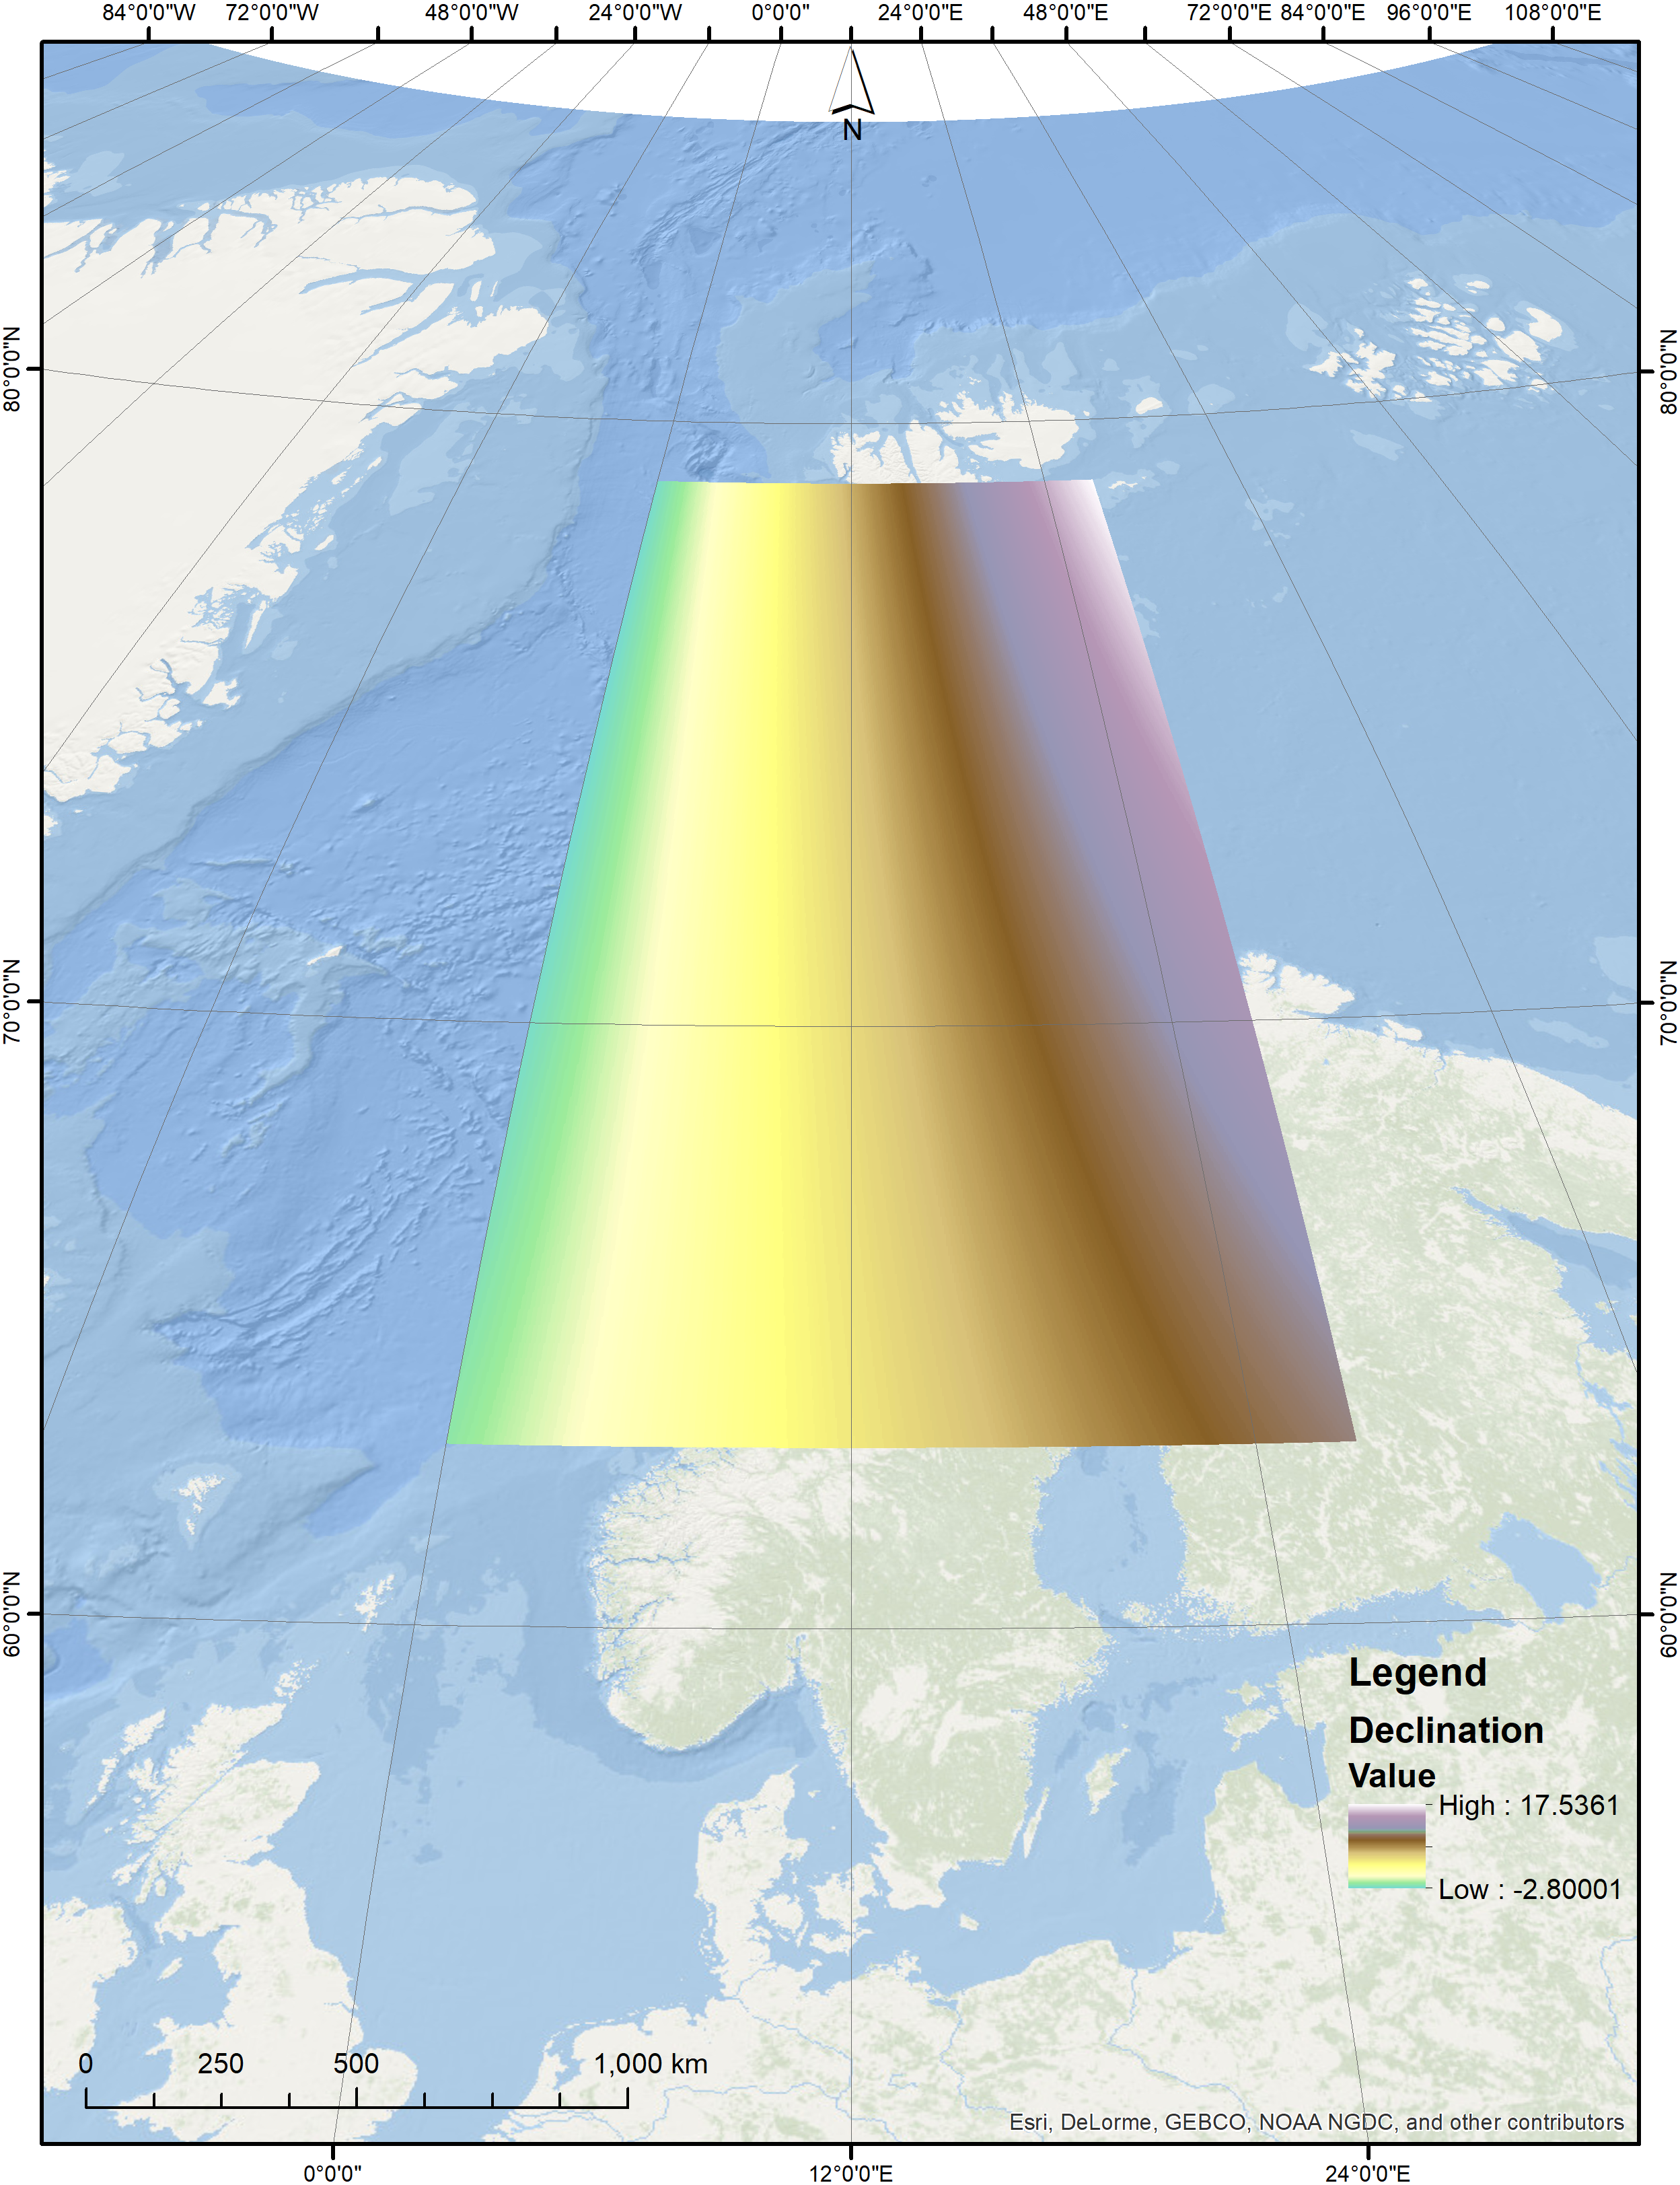
dec = zeros(length(listlat), length(listlon));
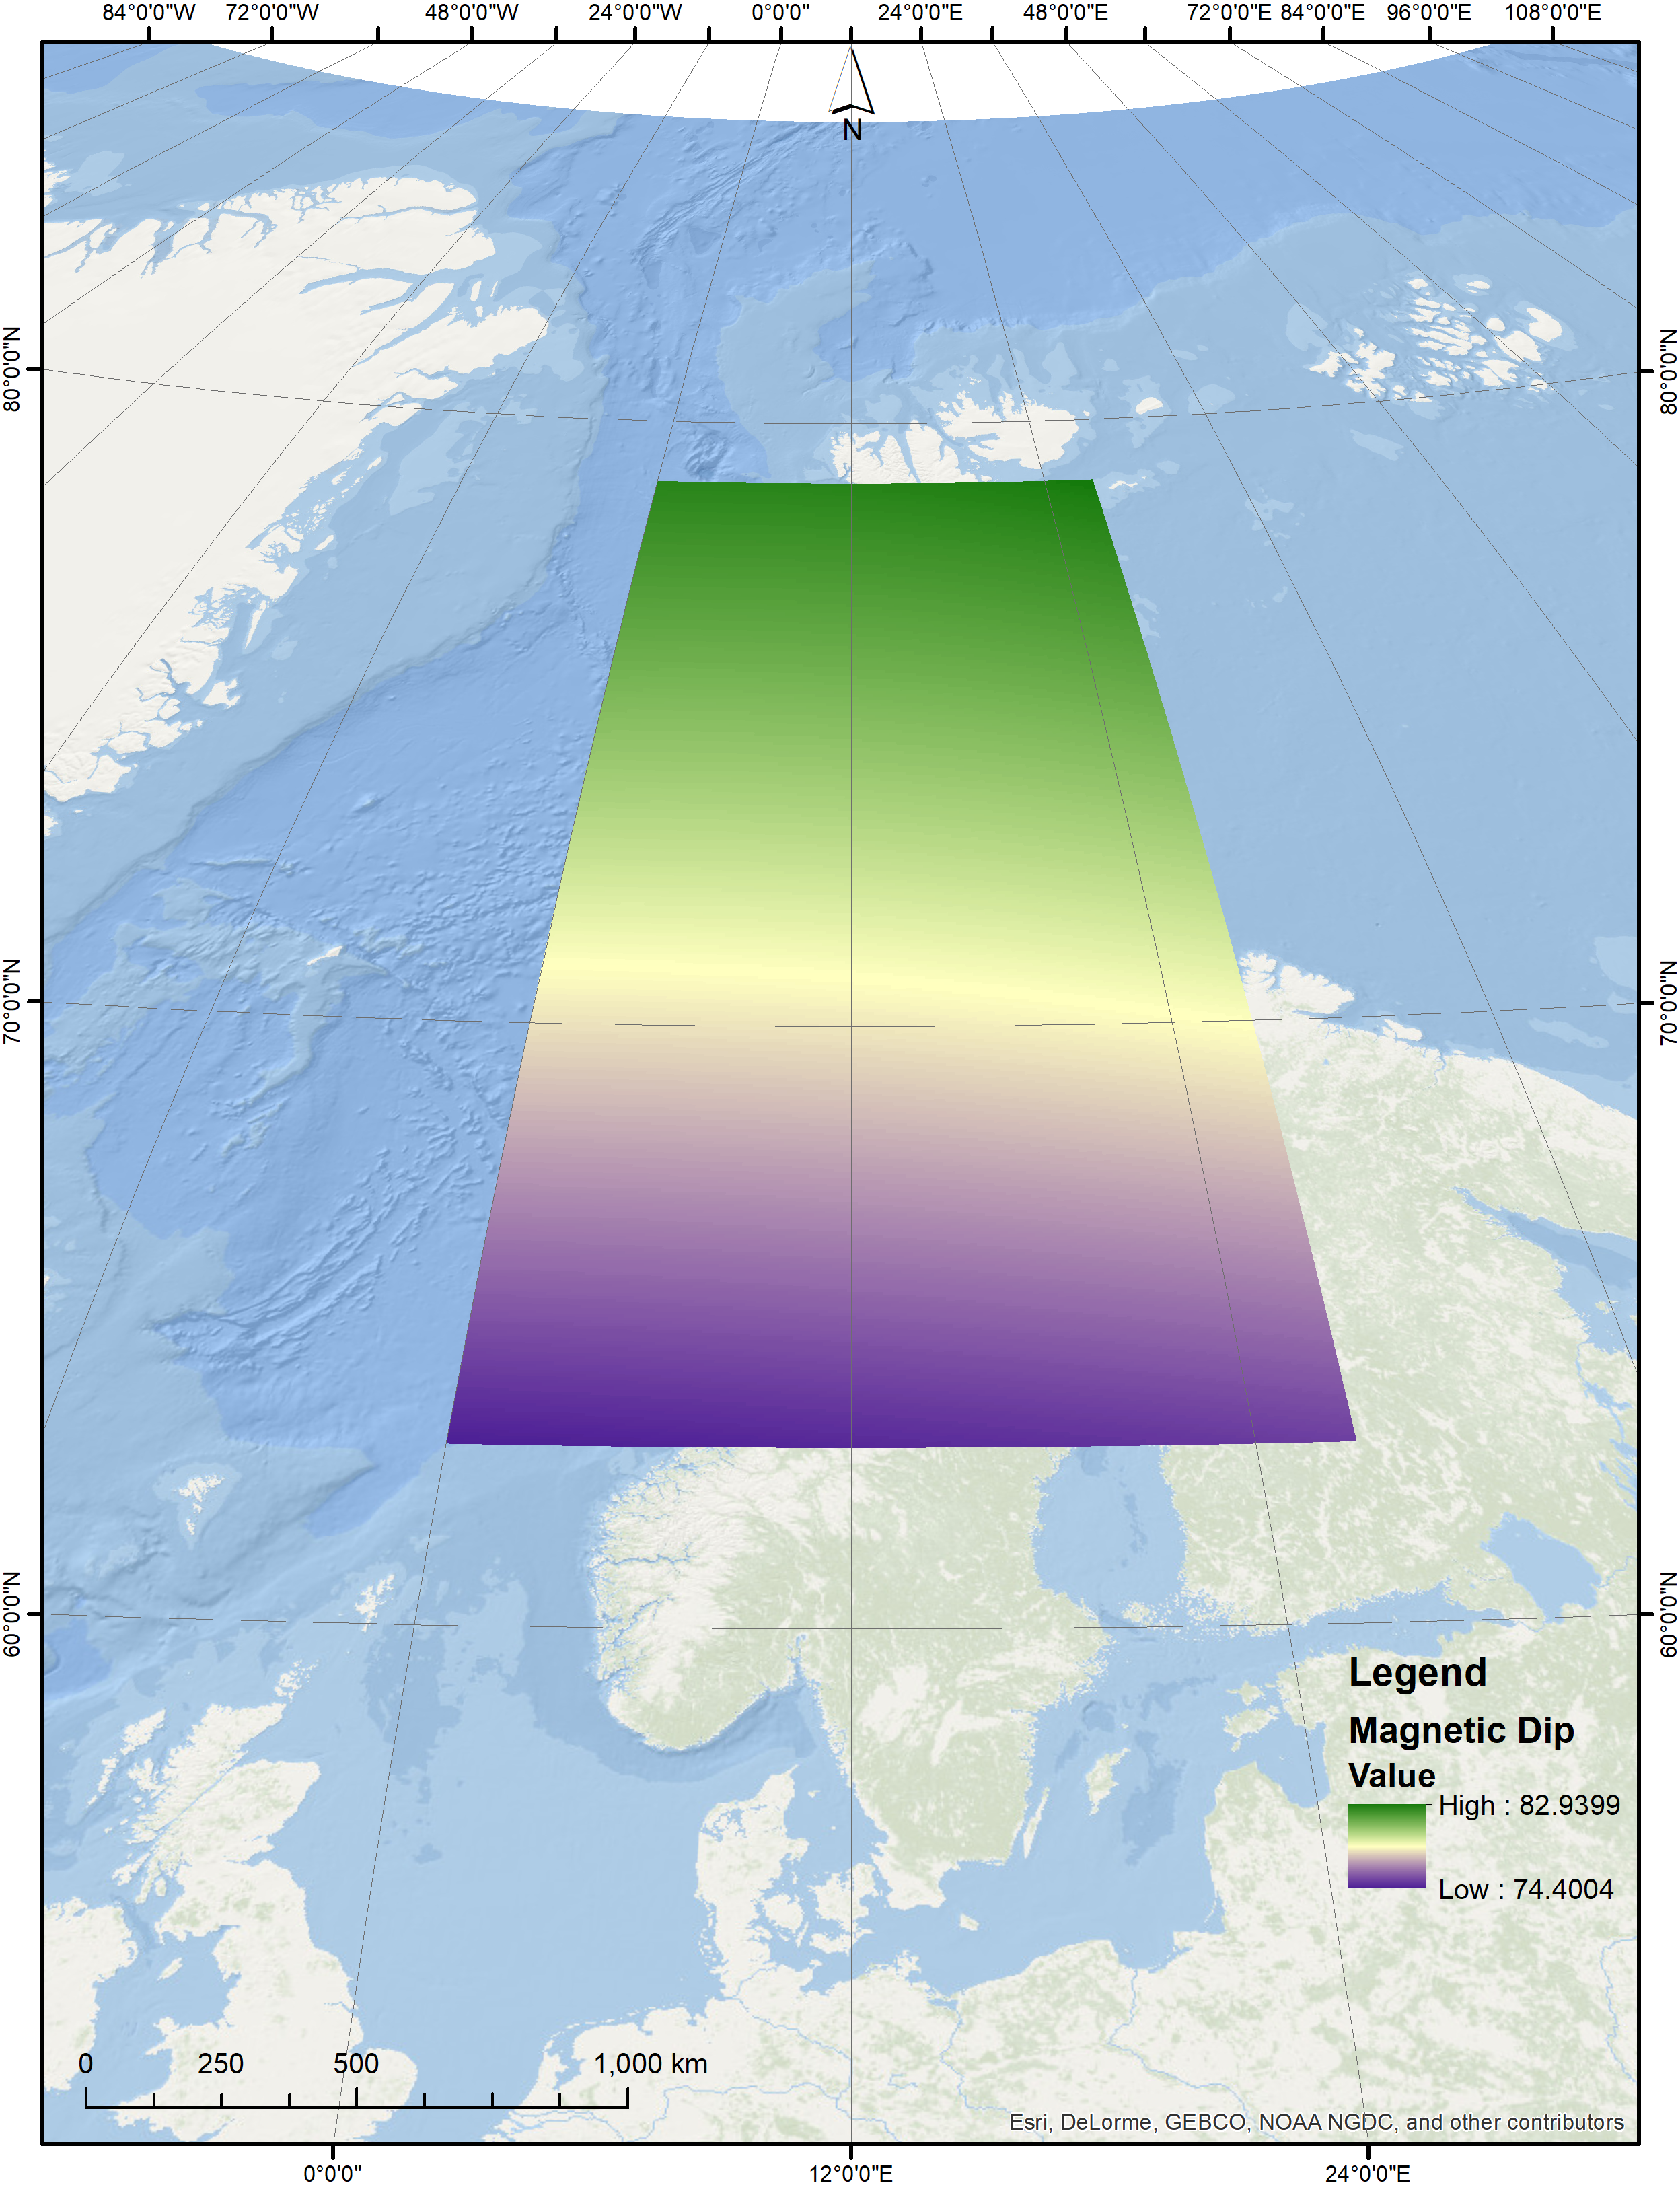
dip = zeros(length(listlat), length(listlon));
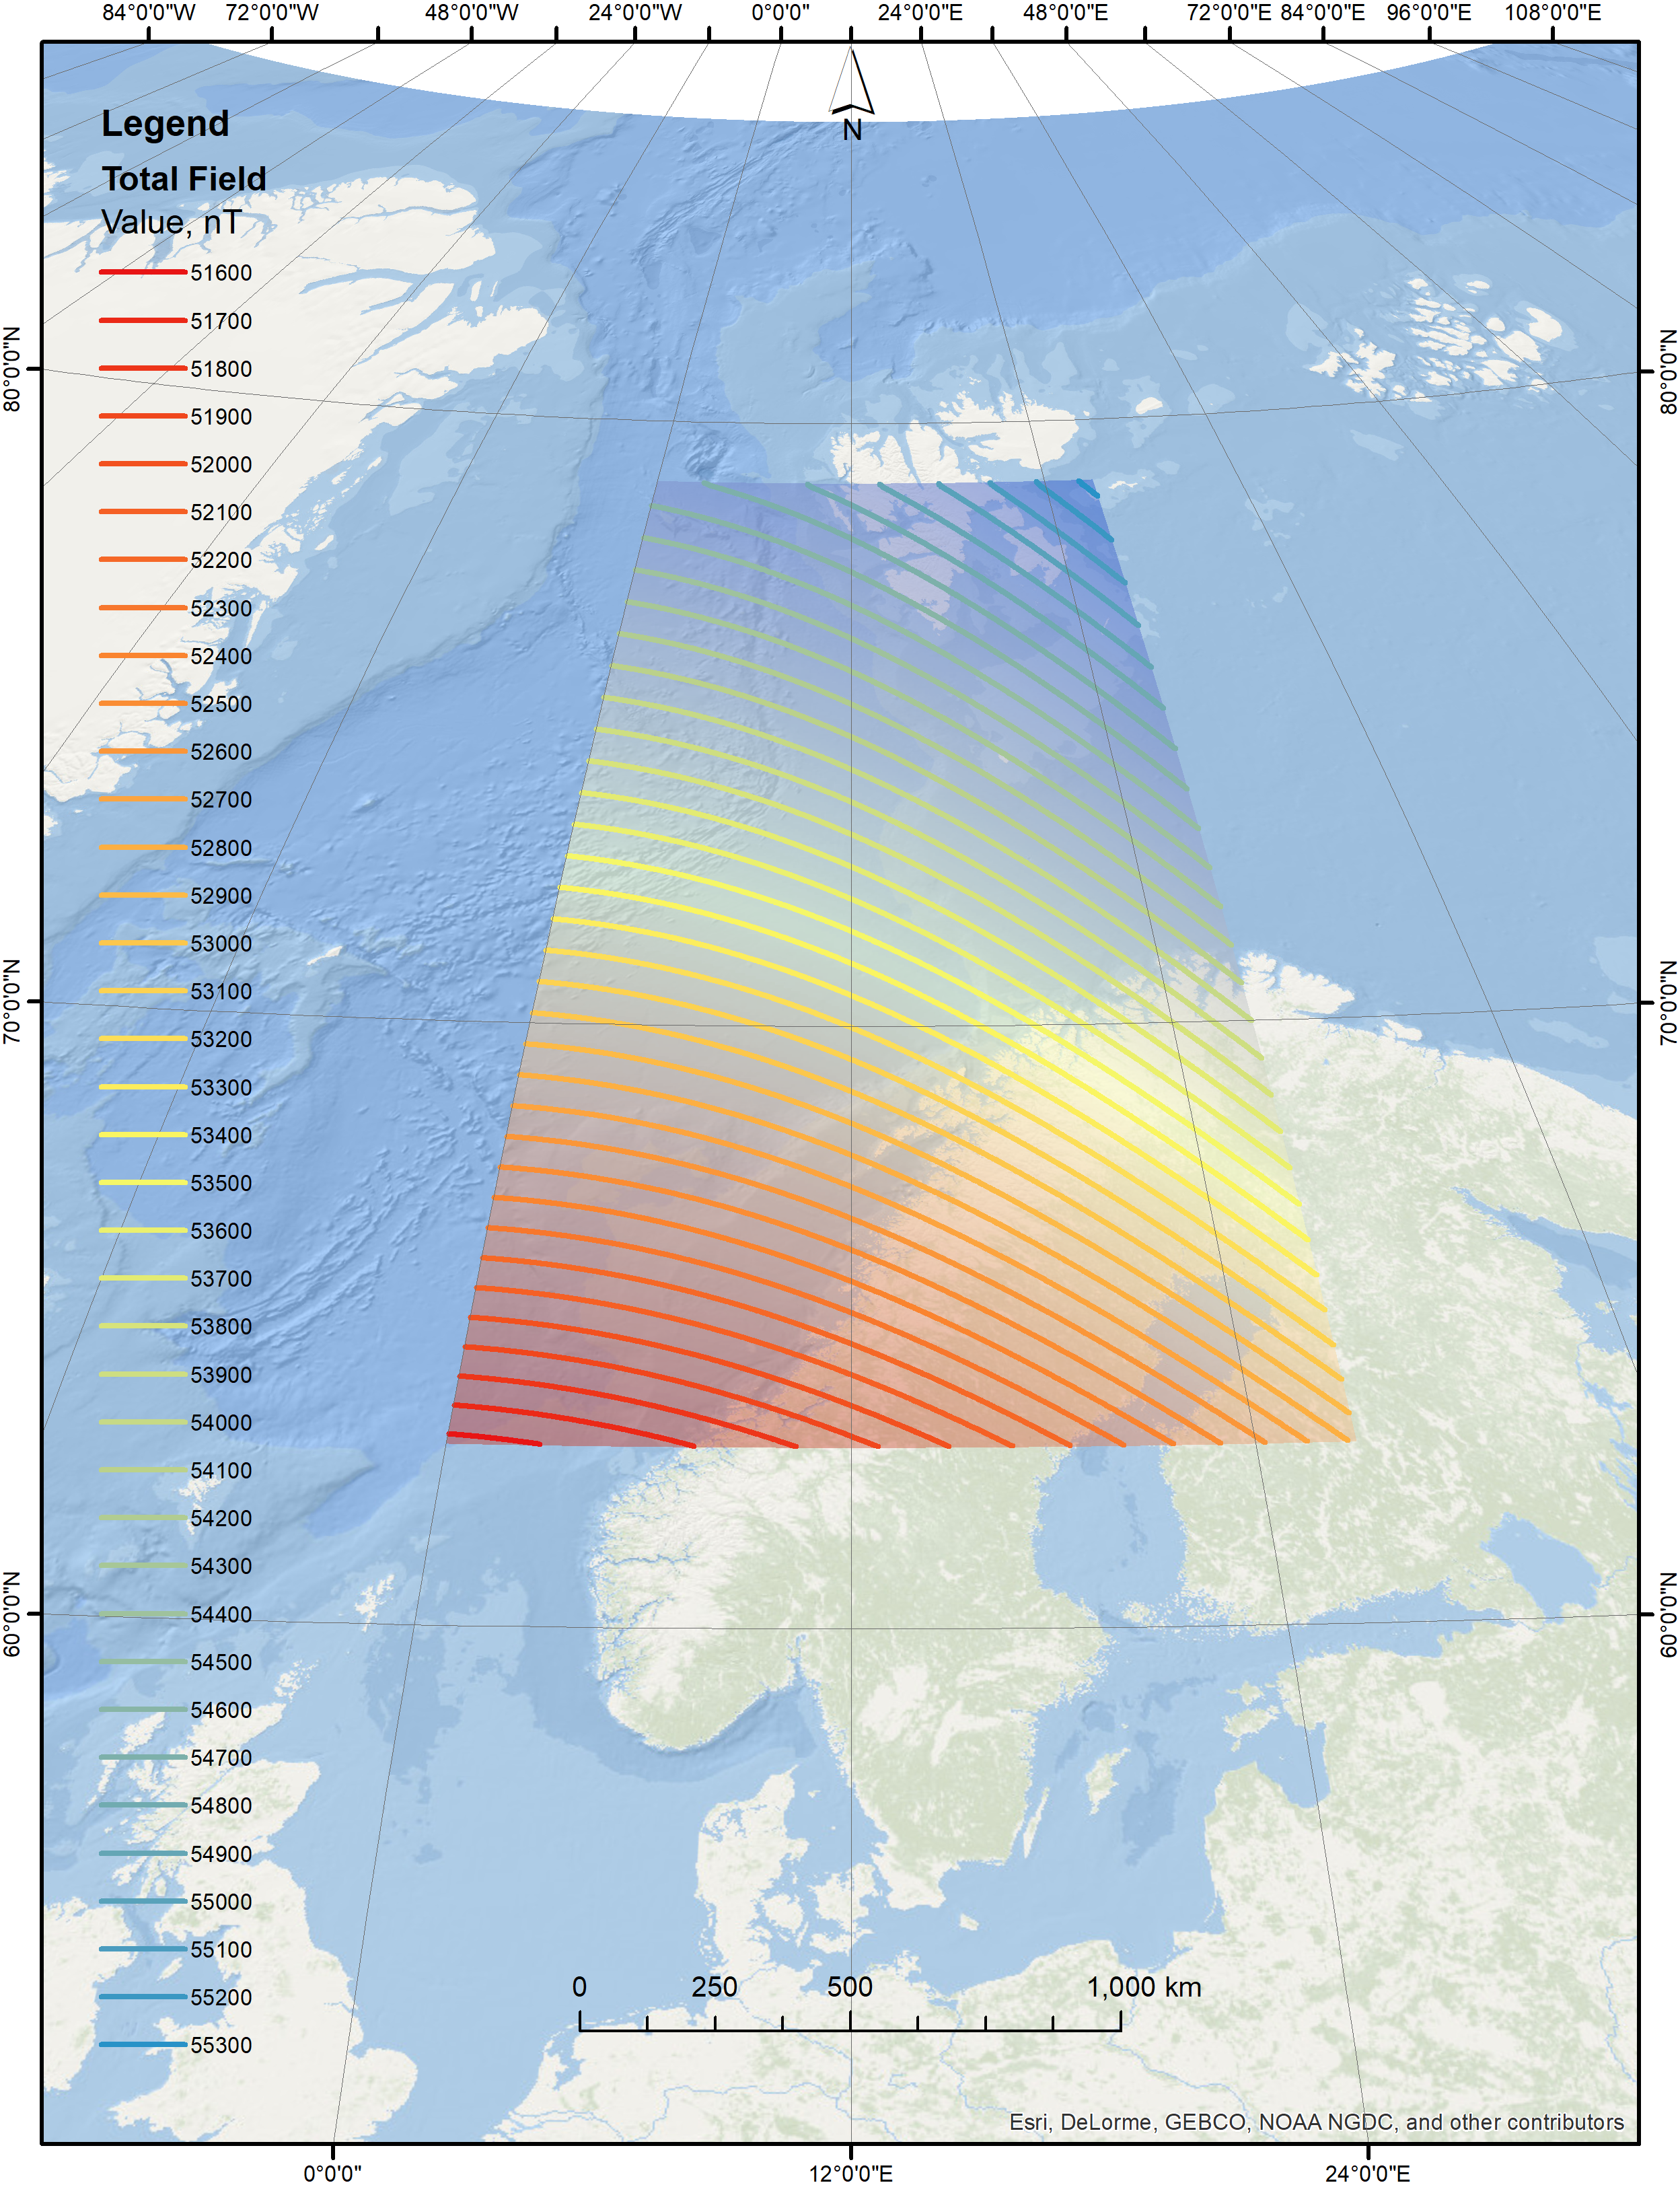
f = zeros(length(listlat), length(listlon));
for i = 1:length(listlat)
for j = 1:length(listlon)
[xyz(i,j,1:3), h(i,j), dec(i,j), dip(i,j), f(i,j)] = ...
wrldmagm(0, listlat(i), listlon(j), decyear(2017,12,5), '2015');
end
end
R = georefcells([listlat(end) listlat(1)],[listlon(1) listlon(end)],...
size(f),'ColumnsStartFrom','north');
filename_geotiff = datafile('WMM_F.tif');
geotiffwrite(filename_geotiff,f,R)
filename_geotiff = datafile('WMM_H.tif');
geotiffwrite(filename_geotiff,h,R)
filename_geotiff = datafile('WMM_Dec.tif');
geotiffwrite(filename_geotiff,dec,R)
filename_geotiff = datafile('WMM_Dip.tif');
geotiffwrite(filename_geotiff,dip,R)
%% IGRF (International Geomagnetic Reference Field)
listlat = lat_clip';
listlon = lon_clip';
%% Magneticfield parameters
%declination, inclination, horizontal component, north component,
%east component, vertical component, and total field
%xyz = zeros(length(listlat), length(listlon), 3);
h = zeros(length(listlat), length(listlon));
dec = zeros(length(listlat), length(listlon));
dip = zeros(length(listlat), length(listlon));
f = zeros(length(listlat), length(listlon));
for i = 1:length(listlat)
for j = 1:length(listlon)
[~,h(i,j),dec(i,j),dip(i,j),f(i,j)] ...
= igrfmagm(0,listlat(i), listlon(j), decyear(2017,12,5),12);
end
end
R = georefcells([listlat(end) listlat(1)],[listlon(1) listlon(end)],...
size(f),'ColumnsStartFrom','north');
filename_geotiff = datafile('IGRF_F.tif');
geotiffwrite(filename_geotiff,f,R)
filename_geotiff = datafile('IGRF_H.tif');
geotiffwrite(filename_geotiff,h,R)
filename_geotiff = datafile('IGRF_Dec.tif');
geotiffwrite(filename_geotiff,dec,R)
filename_geotiff = datafile('IGRF_Dip.tif');
geotiffwrite(filename_geotiff,dip,R)
|